Health & Fitness
Individual Investors Return To Markets…At Six Year Highs
Inside we report on the performance of the stock market for the past week and comment on just how much more you are paying for goods & services.


The Stock Markets picked up right where they left off at the end of the month of January. For the first eight days of February, the stock markets have continued to respond to each short term sell- off by once again working their way higher.
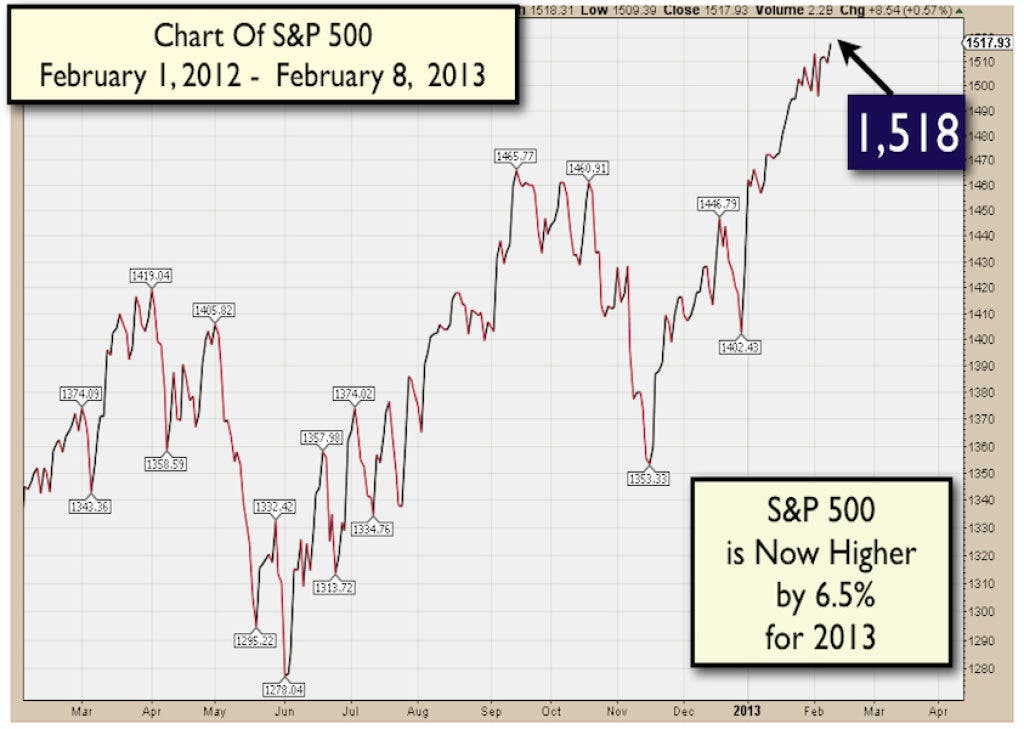
The S&P 500 closed this week at 1,518 – which is a six year high. Every sector of the S&P 500 is trading near their six year highs. Additionally, the technical picture for stocks grows stronger as more stocks are participating in this move to new six year highs than in any other stock market rally over the past 12 months.
So far after one of the best January’s in years, the S&P 500 finds itself higher by 6.5% in 2013.
Find out what's happening in Sammamish-Issaquahwith free, real-time updates from Patch.
In the Photo Section is a one year chart of the S&P 500 that illustrates the markets at their six year highs.
Find out what's happening in Sammamish-Issaquahwith free, real-time updates from Patch.
(See Chart of The S&P 500 in The Photo Section)
We are now in earnings season and so far the majority of companies are reporting earnings and sales that are higher than what wall street had been expecting. Due to the low expectations coming into earnings season, the markets have responded by sending most companies higher after their earnings reports.
On the economic front, it was a relatively quiet week that saw the release of two important reports. First, the Initial Unemployment Claims report came in at 366,000 – right where it was expected and in the same range where unemployment claims have been reported for the past several months. Second, the ISM Non-Manufacturing Report – which measures a large portion of the USA economy – came in at a very healthy 55.2. This was the 37 month in a row that the ISM Non-Manufacturing Report has shown that the economy is expanding.
2013 – The Year that the Small Investor Returned to the Market?
For the past few years the Individual Investor has been mostly absent from the stock markets.
Recently though, this might have changed.
Lipper Inc. is an organization that tracks the inflow of funds into Mutual Funds. Mutual Funds are the favorite investment vehicles for individual investors, and the money flowing in and out of Mutual Funds is a reliable gauge of how the Individual investor is viewing the stock markets. Lipper Inc measures this flow of money and create statistics that are widely regarded as a gauge of investor sentiment.
For the most part since the Financial Crises of 2008 – Lipper had consistently reported net outflows of money (sales) from Mutual Funds each month.
However this changed in January of 2013 when Mutual Funds received the most money from investors in a four week period since 1996. Investors sent a total of $34.2 Billion dollars to Mutual Funds in the month of January, 2013 – this was double the amount of money sent to Mutual Funds in January of 2012.
Some food for thought – this record amount of money being invested in Mutual Funds in January, 2013 is coming after the stock markets have rallied 122% off their financial crises lows of 666 in 2008.
Think you have been spending more for College, Energy & Medical Care? - You are right.
In the past 12 years the price of most everything (with the exception of clothing) has climbed significantly higher. The rate that the general prices of things such as goods and services are rising is known as the inflation rate.
In a dynamic economy the prices of goods and services will be constantly increasing or decreasing at various rates. Over the past decade the prices of all goods and services have increased by 36% – however for some goods and services such as college tuition and energy – the rate of increase has been significantly higher.
In the Photo Section is a 12 year chart of the components of the Consumer Price Index that measures inflation in various types of goods and services used by people each day:
(See Chart of The Growth in Inflation in The Photo Section)
The growth in the rate of overall inflation would have been much higher than 36% if there had not been the collapse in housing prices from their 2007 highs.
Closing Thoughts
How remarkable is it that the stock markets are now only 4.3% away from setting a new all time high?
—
John Patrick Bray, CPA, is President of Bellevue-based Reliance Investment Management LLC a Registered Investment Advisor Firm.
This communication reflects the opinions of Reliance Investment Management LLC and is being provided for informational purposes only and is not intended as a recommendation, an offer or solicitation for the purchase or sale of any security referenced herein or investment advice. It is being provided to you on the condition that it will not form the primary basis for any investment decision. We recommend that you consult with your investment advisor before the purchase or sale of any securities. The information contained herein is of the date referenced and Reliance Investment Management LLC does not undertake an obligation to update such information. Reliance Investment Management LLC has obtained all market prices, data and other information from sources believed to be reliable although its accuracy or completeness cannot be guaranteed. Such information is subject to change without notice. The securities mentioned herein may not be suitable for all investors.
