Health & Fitness
Markets a 'Tie" For the Week - People Grow More Confident in the Economy
Inside we update you on this weeks market activity and take closer look at how much more optimistic people feel now then they did four years ago. See how this affects you.


Technology Stocks Bring the Stock Markets Back Down
Stock markets in the USA surged higher on Monday and continued higher all the way into Thursday Morning as the S&P 500 got within 4 points of making a new 5 year high. But then on Thursday Google mistakenly filed their earnings reports several hours ahead of their official release time. The report from Google created a mini-panic in Google stock as the results of Google’s 3rd quarter was far below markets current expectations. This caused Google to sell off over 9% on Thursday alone – which is quite a large move for a company of Google’s size.
Find out what's happening in Sammamish-Issaquahwith free, real-time updates from Patch.
The action in Google stock served as an anchor on the rest of the markets which sold off on Thursday and continued to sell off on Friday. Other tech leaders such as IBM, Microsoft and Intel earlier also reported earnings that the market found disappointing and they too contributed to the sell-off in technology shares which then sank the rest of the market along with them.
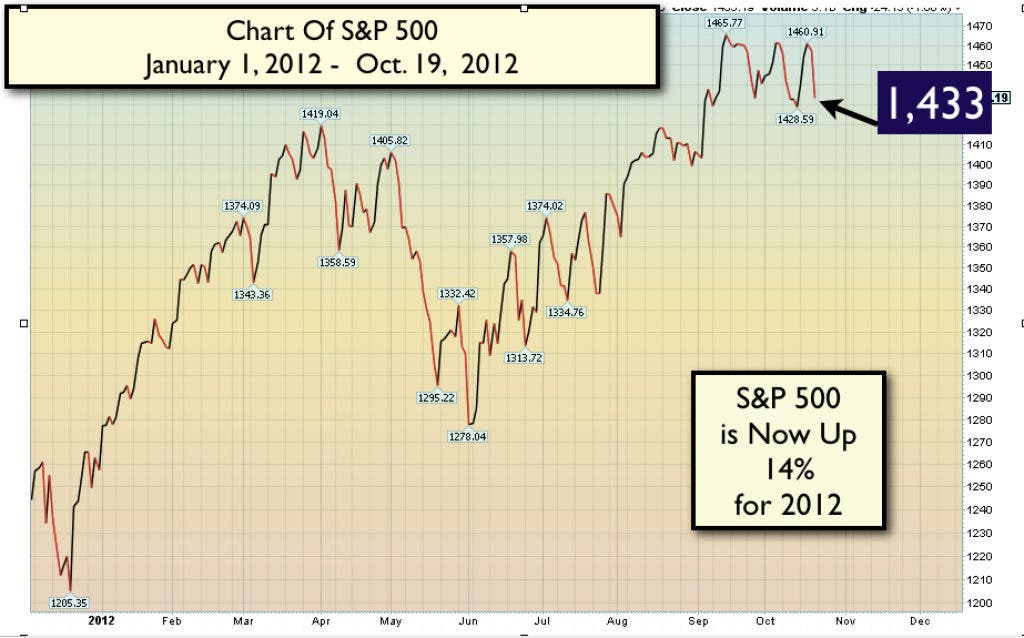
For the week the S&P 500 made a complete round trip – The Index Started the week at 1,429 – went up to near 5 year highs at 1,461 – and then came all the way back down to close at 1,433 – for a net gain of 4 points for the week. In The Photo Section is a chart of the S&P 500 that illustrates the road the Stock Market has taken in reaching it's 14% gain in 2012.
Find out what's happening in Sammamish-Issaquahwith free, real-time updates from Patch.
(See Image of Chart of the S&P 500 in The Photo Section)
Also contributing to the weakness in the stock markets at the end of the week was the reporting of Initial Unemployment Claims which came in at 388,000 – about 20,000 higher than expected.
Other than the disappointing Initial Unemployment Claims – most of the other economic reports came in better then expected. This was especially true of reports that measure how consumers are either feeling about the economy or in the actual spending patterns of people. The most recent economic reports show that people are feeling better about their financial condition today then they have in several years. We wished businesses felt the same as consumers do no but at the moment businesses are a little less optimistic than consumers on the condition of the economy – we explore this further below.
People (Consumers) Turn Optimistic on the Economy – Businesses? Not So Much.
We would like to use this weeks commentary to alert readers to our observations that people are feeling much better today about the economy than compared to the recent past.
We have recently reported about the diminishing outlook for the USA economy that is shared in the USA Business Community. This outlook is contributing to disappointing results in some economic reports in the present and lowered expectations by companies for business conditions and earnings in the near term future.E
We would attribute the business community cautiousness at this time to the following three factors:
- A dramatic slowdown in China
- The recession in much of Europe
- The up-coming “Fiscal Cliff” in the USA that we reported on here last week.
Since all of the economies of the world are correlated, a slowdown in China & Europe will result companies in the USA selling fewer products and services to those China, Asia and Europe.
However for how people (consumers) in the USA are feeling? Well people (unlike businesses) have not felt this good about the economy for several years. Some evidence to support this are:
- USA Jobless Rates are the lowest since 2008
- Auto sales are at their highest since 2008
- Housing Prices are increasing at their fastest rate since 2006
- Consumer Credit growth turned positive in 2012 for the first time since 2008
- Consumer Confidence is now at 5 year highs.
In The Photo Section is a chart of Consumer Confidence which measure how optimistic people are feeling about their financial condition and future prospects. The most recent Consumer Confidence number came in at 83.1 for the month of September. The chart displays the increasing optimism that began from the low at the congressional budget debacle of August 2011, when Consumer Confidence fell to it’s post 2008 recessions lows. Note also a second surge higher in Consumer Confidence that began around April of this year.
(See Image of Chart of the Consumer Confidence in The Photo Section)
Another area of the economy that is benefiting from a renewed optimism from consumers is housing. Housing starts have started to accelerate again (though from their lowest levels in a decade). Record low interest rates and the Federal Reserve Quantitative Easing programs are definitely a contributing factor to recent success of the housing market.
In The Photo Section is a chart of New Housing Starts for the USA. The most recent report for housing starts showed that there were 872,000 starts in the month of September. This is highest number of new housing starts since 2008. This is especially good news for the jobs market as outside of manufacturing, housing creates the most jobs for people.
It is also nice to see the recent sharp move higher on this chart also that began in June.
(See Image of Chart of New Housing Starts in The Photo Section)
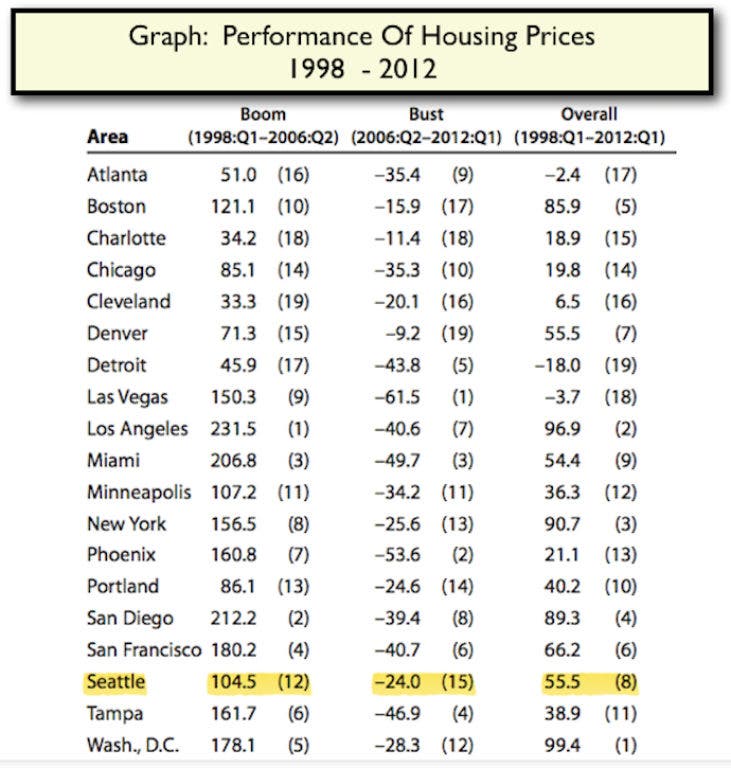
Many people in the Seattle – Bellevue – Tacoma areas are curious to know how our local housing market has performed when compared to other markets around the country for the last 15 years. We provide an answer to this.
In The Photo Section is a chart that presents the price performance for housing in the greater Seattle – Bellevue – Tacoma areas. The data is from the Case-Schiller Home Prices Index. There are three categories:
- How much House prices increased from 1998 – 2006 (The Boom Period)
- How much House prices went down from 2006 – 2012 (The Bust Period)
- The Net Change in Housing Prices from 1998 – 2012 (Overall)
We have highlighted the performance of the Seattle Housing Market in Yellow. Homes in the Seattle area have fared much better than most of the country during the bust period when homes lost an average of 24% in the greater Seattle area.
(See Image of Chart of House Price Performance - Greater Seattle Area in The Photo Section)
From our observations locally – it appears that selling prices for real estate has started to rise again for the first time in several years.
Closing Thoughts
We have recommended in earlier columns that with interest rates at all time lows that if it makes sense for your financial situation, you should go long interest rates at this time.
For those people who would like more information on how to choose the right mortgage for you we have a short video on our website that you can watch by clicking here.
The recent sell-off in technology stocks has caught our interest. From a review of our technical indicators we can see the Technology sector is very over-sold now. We expect the technology sector to remain under pressure for another 2-3 weeks and if there is another leg lower it could set up some opportunities for increasing your portfolio’s Technology exposure. There are many different startegies available for doing this. As with all investment decisions we recommend you consult with your financial advisor to determine it’s suitability for you. If you are interested in ways of investing in technology then please feel free to contact Reliance to explore the opportunity.
---
John Patrick Bray, CPA, is President of Bellevue-based Reliance Investment Management LLC a Registered Investment Advisor Firm.
This communication reflects the opinions of Reliance Investment Management LLC and is being provided for informational purposes only and is not intended as a recommendation, an offer or solicitation for the purchase or sale of any security referenced herein or investment advice. It is being provided to you on the condition that it will not form the primary basis for any investment decision. We recommend that you consult with your investment advisor before the purchase or sale of any securities. The information contained herein is of the date referenced and Reliance Investment Management LLC does not undertake an obligation to update such information. Reliance Investment Management LLC has obtained all market prices, data and other information from sources believed to be reliable although its accuracy or completeness cannot be guaranteed. Such information is subject to change without notice. The securities mentioned herein may not be suitable for all investors.